SPSS FOCUS
A comprehensive guide to statistical analysis in SPSS
Paired Samples t-test in SPSS
A paired samples t-test, also known as dependent samples t-test, is a statistical method used to compare the means of two related groups. This test is appropriate when the same participants are measured at two different points in time or under two different conditions, such as before and after an intervention or when comparing two related units like siblings or matched pairs.
Introduction to Paired-samples T-test
When data are collected from the same participants (i.e., one group) on two occasions (e.g., before and after implementing a new teaching method), the independence of the data is compromised, so an independent samples t-test cannot be used. In such cases, a dependent samples t-test is appropriate, as the data points are related due to the same participants being measured twice. For instance, a researcher might study the effect of a new teaching method on students’ math scores. The researcher administers a math test at the beginning of the course and the same test at the end, after students have experienced the new teaching method. The researcher then compares the students’ mean scores before and after the intervention.
The primary goal of a paired samples t-test is to determine whether there is a statistically significant difference between the paired observations. This test calculates the differences between paired observations and then assesses whether the average difference is significantly different from zero. Key assumptions for the dependent samples t-test include normally distributed difference scores and the absence of outliers. Researchers commonly use this test in fields such as psychology, education, and medicine to evaluate changes or effects resulting from specific treatments or interventions.
An important assumption when conducting a paired samples t-test is that the difference scores (i.e., scores from the first occasion subtracted from the second occasion) should be normally distributed.
In the following sections, we present an example research scenario where a paired samples t-test will be used to analyze the data. We will demonstrate how to perform a paired samples t-test in the SPSS program step-by-step and how to interpret the SPSS results.
Paired Samples T-test Example
Does the consumption of cardamoms have an effect on blood pressure levels?
A health researcher is interested in knowing if consuming cardamom on a daily basis has a noticeable effect on blood pressure. The researcher randomly selects 30 participants and measures their blood pressure at the start of the study. During the study, the participants consume 3 grams of powdered cardamom daily for 14 weeks. At the end of the experiment, the researcher measures their blood pressure again to see if there is any improvement due to cardamom consumption.
In this study, there are two measurement occasions (before and after the cardamom consumption period) and one group. Therefore, the researcher uses a paired (dependent) samples t-test to compare the means of the same group over two measurement occasions. Table 1 includes the blood pressure readings of five participants on both occasions.
| Participant | BP Before | BP After |
|---|---|---|
| Participant 1 | 132 | 134 |
| Participant 2 | 137 | 117 |
| Participant 3 | 163 | 129 |
| Participant 4 | 141 | 129 |
| Participant 5 | 141 | 128 |
| … | … | … |
The health researcher enters the data in the SPSS program in the hospital computer lab. The data for this example can be downloaded in the SPSS format or in CSV format.
Entering Data into SPSS
To enter the data in the SPSS program, start by clicking on the Variable View tab (bottom left) and create three variables under the name column: Participant, BP01 (blood pressure at time 1), and BP02 (blood pressure at time 2). Specify the following attributes for each variable:
- Participant: Type is string. Width is 16. Measure is Nominal.
- BP01: Type is Numeric. Measure is Scale.
- BP02: Type is Numeric. Measure is Scale.
When defining the variables, we must specify both the data type and the measurement level in SPSS. The data type is how the computer reads the data, while the measurement level is used by the statistical algorithm during computation. In this example, the Participant ID consists of names and is not involved in the analysis, so we select “string” as the data type and “nominal” as the measurement level. For the Blood pressure variables, we choose the data type as numeric and measurement as scale (continuous).
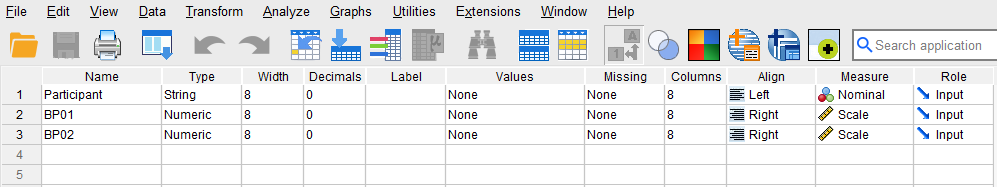
In the first step, we create the variables to enter the data. We have three variables: Participant, BP01 (Blood pressure before the start of the cardamom consumption program), and BP02 (Blood pressure measured after the program). We specify the data types and measurement levels for each variable as above. We set the data type for Participant to string and its measurement level to nominal. For blood pressure readings (BP01 and BP02), we set the data type to numeric and the measurement level to scale. Figure 1 shows how the variable specification should look like in the SPSS Variable View for this example.
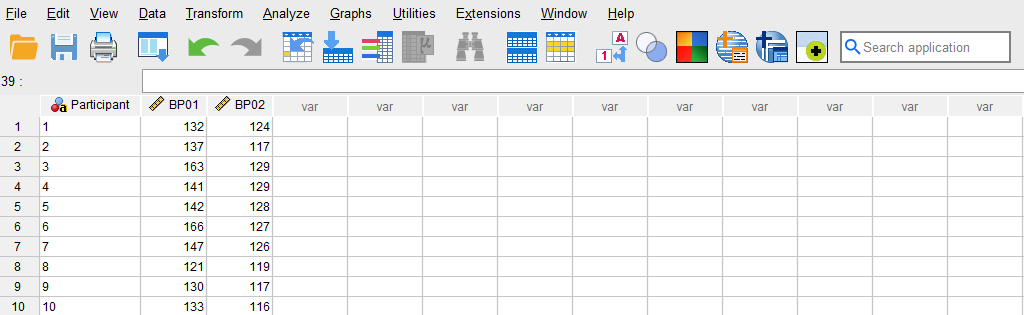
Once the variables are created, we can enter the data in the columns Participant, BP01, and BP02. As specified in the Variable View, for Participant we can enter their names or an ID. For the variables BP01 and BP02, we can directly enter the blood pressure readings at time 1 (BP01) and at time 2 (BP02), or copy and paste from a spreadsheet. Figure 2 shows the blood pressure data for the first five participants in the Data View window of the SPSS program.
Now we are ready to conduct a paired-samples t-test in SPSS!
Analysis: Paired Samples T-test in SPSS
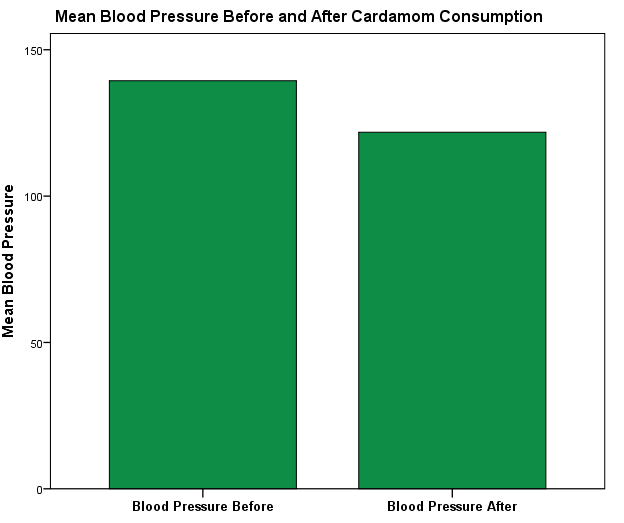
A paired samples t-test is a statistical method used to compare means between two related measurements. In our study scenario, the researcher is interested in knowing if cardamom consumption has any significant effect on participants’ blood pressure. Figure 3 shows a bar plot of the mean blood pressure of the participants before and after cardamom consumption.
In this example, the same group of participants is measured twice: once before and once after the cardamom consumption period. We compare the participants’ mean blood pressure readings before and after cardamom consumption using the paired samples t-test.
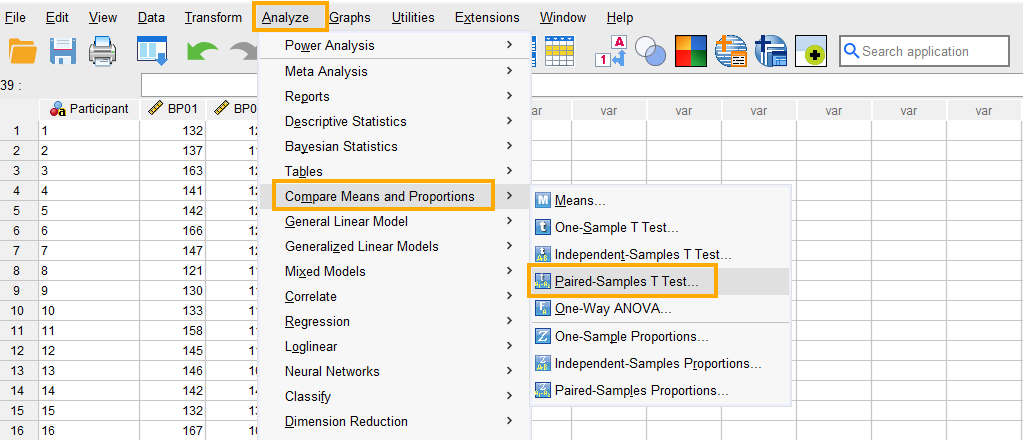
In SPSS, the paired samples t-test can be accessed through the menu Analyze / Compare Means and Proportions / Paired-Samples T Test. As shown in Figure 4, we click on Analyze, then choose Compare Means, and finally select Paired-Samples T Test.
After clicking on Paired-Samples T Test, a window will appear prompting for creating a paired comparison between Variable 1 and Variable 2. From the left panel, we send BP01 into Variable 1 box and BP02 into Variable 2 box as shown in Figure 5 below. Sending the variables in the opposite order (BP02 and then BP01) will not affect the results of the paired samples t-test. The only change would be in the sign of the mean value difference or the observed value of the t statistic (negative or positive, depending on order of the variables entered).

Finally, we press OK in the window to run the paired samples t-test.
Interpreting Paired Samples T-test in SPSS
In this study, the health researcher aimed to investigate the effectiveness of cardamom consumption on participants’ blood pressure levels. A paired samples t-test was conducted to compare the mean blood pressure readings before and after the cardamom consumption period. The SPSS results for the paired samples t-test include three tables: a table for descriptive statistics (Paired Samples Statistics), a table showing the correlation between the blood pressure readings at time 1 and time 2, and a table for the Paired Samples Test results (Paired Samples Test).
Figure 6 displays the Paired Samples Statistics table, which includes the mean blood pressure readings before and after cardamom consumption (Mean), the sample size (N), the standard deviation from the mean, and the standard error of the mean.
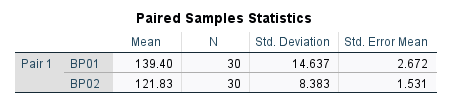
According to the descriptive statistics, the mean blood pressure before the consumption of cardamom was 139.40 and the mean blood pressure after the consumption of cardamom was 121.83, which shows a decrease of 17.57. But is a 17.57 drop in blood pressure statistically significant to claim the relative effectiveness of cardamom in lower blood pressure? We can determine this by referring to the Paired Samples Test table (the third table in the SPSS output and Figure 7 below).
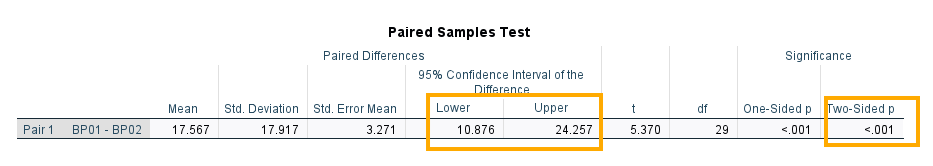
As Figure 7 above shows, the difference between BP01 and BP02 mean values is 17.567 and the t value is 5.370 with 29 degrees of freedom. The two-sided p value shows < 0.001 (p < 0.05), which is below the criterion 0.05 (and 0.025 for two-tailed hypothesis). Therefore, we conclude that a decrease of 17.567 units in blood pressure after the consumption of cardamom was statistically significant. In addition, the 95% confidence interval for the difference between the means was 10.876 to 25.257, indicating that the difference of 17.567 points in mean values was statistically significant. The last table in the output for paired samples t-test shows the effect size of the difference between the two means (Figure 8).
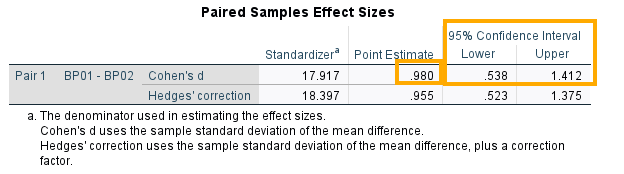
As shown in Figure 8, Cohen’s d effect size is 0.98, which indicates the change from BP01 to BP02 is large and meaningful. The average person in the sample showed almost a full standard‑deviation shift between the two blood pressure measurements. In addition, the 95% confidence interval is above 0 and shows moderate to large effect size (0.54 to 1.41).
Reporting Paired Samples T-test Analysis Results
In this study, we were interested in investigating the effectiveness of cardamom consumption on participants’ blood pressure levels. A random sample of 30 participants was recruited to measure their blood pressure before and after cardamom consumption. The mean blood pressure before consuming cardamom was 139.40, with a standard deviation (SD) of 14.64. After the cardamom consumption period, the mean blood pressure was 121.83, with a standard deviation (SD) of 8.38, indicating a decrease of 17.57 units.
A paired samples t-test was conducted to compare the blood pressure readings before and after cardamom consumption. There was a significant difference in blood pressure readings between the two measurements, t(29) = 5.370, p < 0.05. The 95% confidence interval for the difference between the means was 10.876 to 25.257, indicating that the 17.567-unit difference in mean blood pressure was statistically significant.
The results suggest that consuming cardamom has a significant effect in reducing blood pressure levels. Participants who consumed cardamom experienced, on average, a decrease of 17.567 units in their blood pressure. This finding supports the hypothesis that cardamom consumption can significantly lower blood pressure.