SPSS FOCUS
A comprehensive guide to statistical analysis in SPSS
Measures of Dispersion in SPSS
Measures of dispersion refer to values that show how spread out or concentrated our data points are. In other words, measures of dispersion summarize the amount of variation in our data set. Such measures help us understand if the distribution of the data deviates from an expected shape, or if there are anomalies in the data, or if the data is inclusive of all possible cases. In addition, such measures are often used in other statistical methods for the purpose of normalization of data and computing other statistics. Range, interquartile range, variance, and standard deviation are some of the most common measures of dispersion reported in descriptive statistics. Measures of dispersion and measures of central tendency are usually reported together as descriptive statistics in research reports.
Range
The range of distribution of data is the difference between the greatest (maximum) and smallest (minimum) value in the data. Because range is a value that covers the entire data set, it is a measure of the dispersion (spread) of the distribution. For example, if the range of blood pressure in female patients is 20 and the range of blood pressure in male patients is 15, we understand that there is less variation in the distribution of blood pressure data in male patients. Large range values may hint at existence of extreme values or data entry errors in data. Range is calculated as:
One application of range is the normalization of data (also known as scaling, because the scale of the data changes by transformation), especially in machine learning. Because data may have a large spread, transforming the data by its range (which includes the maximum and minimum values) makes the results of analysis more robust. Min-max normalization or scaling uses range in the denominator through the following formula:
Interquartile Range (IQR)
While range is a single value that covers the entire distribution of the data, interquartile range (IQR) is a measure of dispersion that covers the middle of the distribution (when sorted, the middle 50% of the data). The interquartile range (IQR) is the difference between the third and first quartiles, representing the spread of the middle 50% of the sorted data. Interquartile range can be used for detecting outliers, describing skewed distributions, summarizing ordinal variables. One application of the interquartile range is detecting outliers in a distribution (known as Turkey Outlier Rule) using the formula:
Values outside this range are treated as outliers.
Variance
Variance is another important measure of dispersion of a distribution that measures how far the values are (deviate) from the mean of the distribution, summarizing it by averaging the squared deviations from the mean. When the variance is small, it implies that the data points are close to the mean and when the variance is large, it implies that the data are more spread out from the mean. Variance is a key building block for many other statistics, including the standard deviation, and statistical methods, such as analysis of variance (ANOVA). In a sample data set, the variance is calculated as follows:
Because the distance between each data point and the mean is squared in the process of calculating the variance, the value of variance is not on the same scale as the original data distribution.
Standard Deviation (SD)
The most common measure of dispersion when the data is approximately normally distributed is the standard deviation. Standard deviation shows the average deviation of data points from the mean of the distribution and it is on the same scale as the original data (unlike the variance). A small standard deviation indicates that the data points cluster closely around the mean, while a large one signals greater spread. Sample standard deviation can be calculated by taking the square root of the sample variance:
Standard deviation plays a central role in statistical analysis—from describing distributions to evaluating model assumptions, detecting outliers, and comparing variability across groups. Standard deviation can be used to detect outliers by flagging observations that lie several standard deviations away from the mean, typically beyond ±3 SD, where values are statistically unlikely in a roughly normal distribution.
Calculating Range, Interquartile Range, Variance, and Standard Deviation in SPSS
We demonstrate how the range, interquartile range, variance, and standard deviation of a variable (measures of dispersion) are calculated in SPSS using blood pressure measurement dataset. The dataset can be download as SPSS format or CSV format. The data includes blood pressure measurements of 30 patients at two time points (BP01 and BP02). Once downloaded, we open the data file in SPSS. We are interested in knowing the range, interquartile range, the variance, and the standard deviation of blood pressure measurements at Time 1 (BP01).
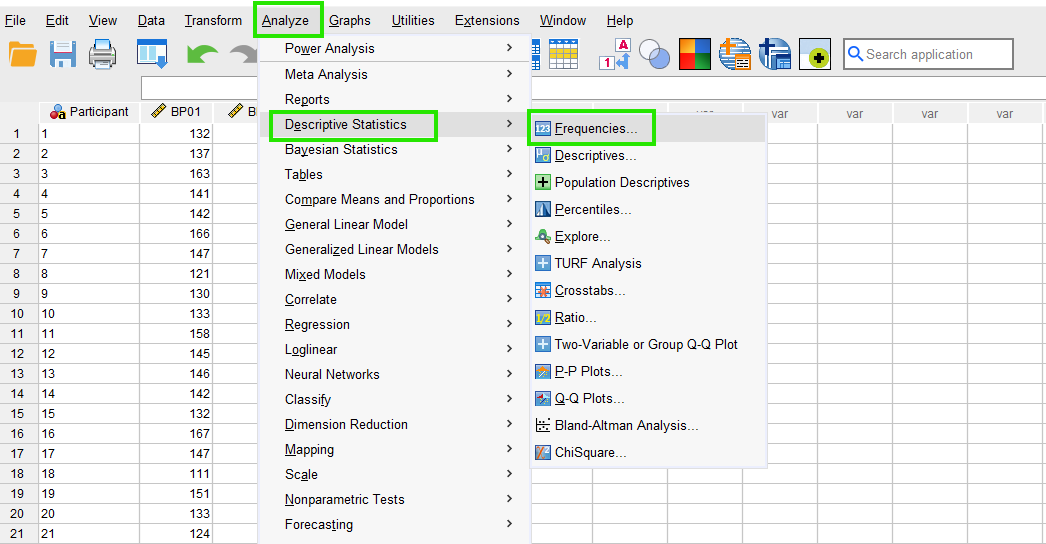
In SPSS, measures of dispersion can be accessed together through the menu Analyze / Descriptive Statistics / Frequencies. So, as Figure 1 shows, we click on Analyze and then choose Descriptive Statistics and then Frequencies.
After clicking on Frequencies, a new window will pop out asking for the variable name (BP01). So, we send BP01 to the Variables box (Figure 2).
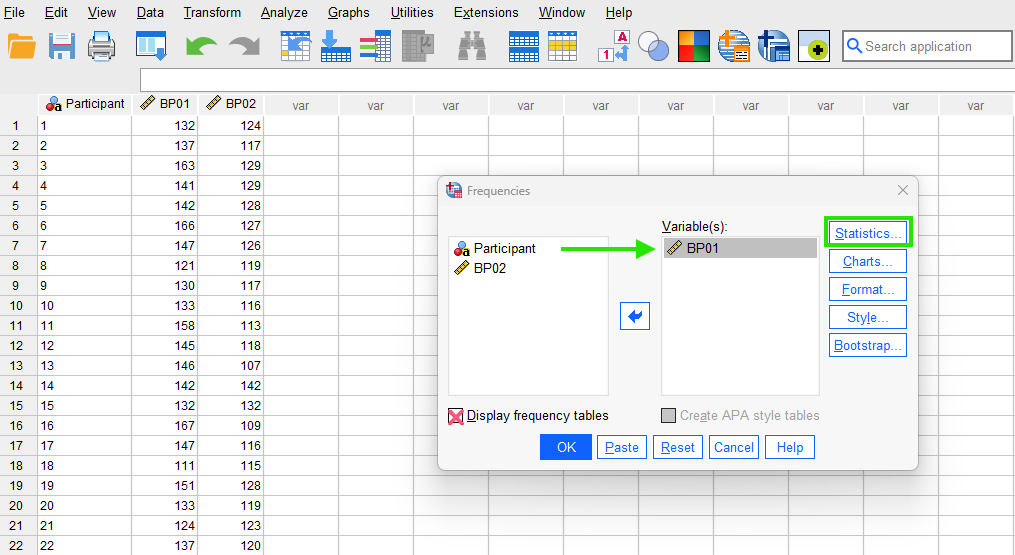
While still in this window, we click on Statistics button to choose measures of dispersion (Figure 3).
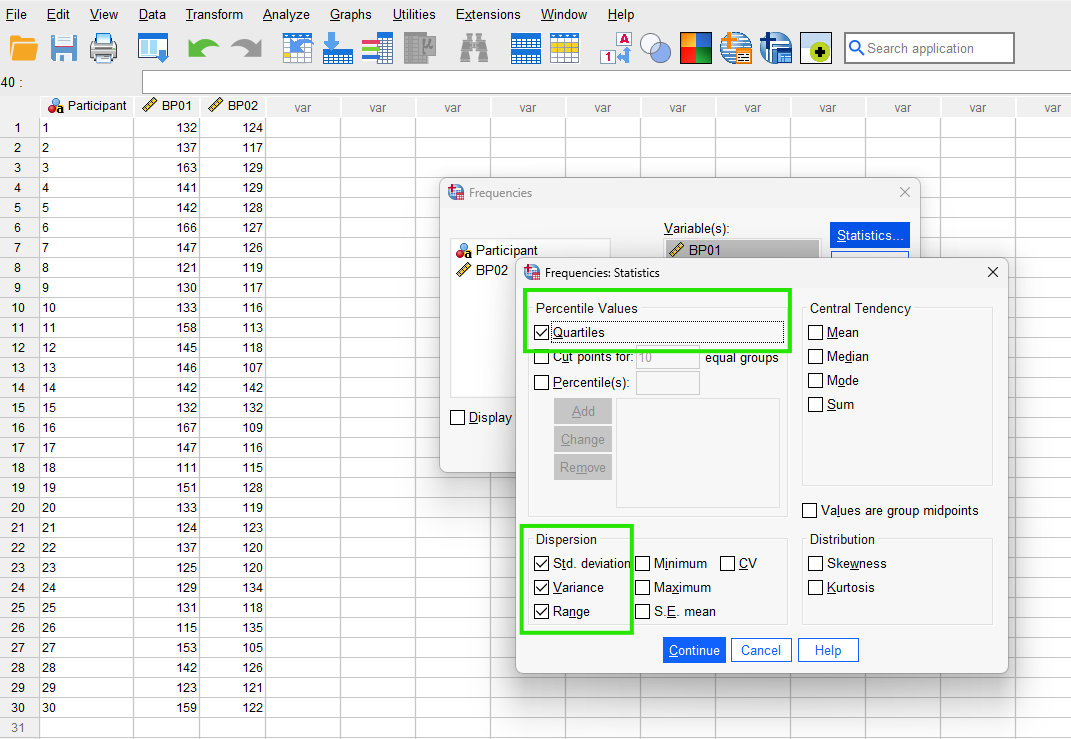
In the Statistics window, under Dispersion, we tick the boxes for Std. deviation, Variance, and Range. In addition, under Percentile Values, we tick Quartiles (to calculate interquartile range from the difference between third quartile and the first quartile) and click on Continue and finally on the OK button.
The SPSS output shows the results in a table. The Statistics table (Figure 4) returns the values for the standard deviation, the variance, the range, and the first (25th), the second (50th), and the third (75th) quartiles.
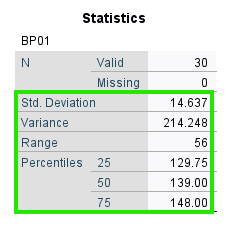
According to the Statistics table, the standard deviation = 14.637, the variance = 214.248, the range = 56. The interquartile range is not printed in this output but can be calculated by subtracting the 25th quartile from the 75th quartile, as follows: