SPSS FOCUS
A comprehensive guide to statistical analysis in SPSS
Kappa and Weighted Kappa in SPSS
Kappa and weighted Kappa coefficients are common measures of inter-rater reliability or agreement between two raters or measurement occasions. Cohen’s unweighted and weighted Kappa inter-rater reliability measures are used to assess the degree of agreement between two raters when the ratings are nominal or (ordered) categorical. Unweighted kappa is used when the difference between categories is equal. Weighted kappa is used when the distance between categories is not equal and therefore weights are assigned to change distance between categories according to subject matter experts or evidence.
Introduction to Cohen’s Kappa
Inter‑rater reliability is a cornerstone of empirical research and applied evaluation, ensuring that independent raters produce consistent judgments when classifying or categorizing data. The Kappa coefficient was developed to quantify this agreement beyond chance, offering a more rigorous measure than simple percent agreement. For example, if two physicians independently diagnose patients as having “mild,” “moderate,” or “severe” symptoms, Kappa provides a statistical index of how closely their ratings align, correcting for the possibility that some agreement may occur randomly. This makes Kappa particularly valuable in fields such as psychology, medicine, and quality control, where categorical judgments are frequent and reliability is essential. Statistical tests of association, such as Pearson or Spearman correlations, are not appropriate to evaluate agreement between raters.
Unweighted Kappa, often referred to as Cohen’s Kappa, is most appropriate when categories are nominal and carry no inherent order. For instance, when two reviewers classify articles as “relevant” or “irrelevant,” each disagreement is treated equally, regardless of the specific categories involved. This approach is straightforward and effective when the distinction between categories is purely qualitative, but it does not account for the severity or closeness of disagreements.
Weighted Kappa extends this framework to ordered categories, assigning partial credit to disagreements that are less severe (i.e., allowing for partial match between raters). For example, in evaluating product quality as “Like new,” “Good,” or “Acceptable,” a disagreement between “Like new” and “Good” is less consequential than one between “Like new” and “Acceptable.” Weighted Kappa incorporates this logic, making it the preferred measure when categories are ordinal. By distinguishing the magnitude of disagreement, weighted Kappa provides a more nuanced and accurate reflection of inter‑rater reliability in contexts where gradations of judgment matter.
Values of Kappa range from –1 to +1, with negative values indicating systematic disagreement, 0 reflecting chance‑level agreement, and higher values denoting stronger agreement. Common guidelines for interpreting Kappa coefficients are shown in Table 1.
| Kappa Coefficient | Strength of Agreement (Landis & Koch, 1977) |
|---|---|
| < 0.00 | Poor |
| 0.01 – 0.20 | Slight |
| 0.21 – 0.40 | Fair |
| 0.41 – 0.60 | Moderate |
| 0.61 – 0.80 | Substantial |
| 0.81 – 1.00 | Almost perfect |
This interpretive scale ensures that researchers can meaningfully evaluate the strength of inter-rater reliability in diverse applied contexts.
Kappa and Weighted Kappa Example
How reliable is the assessment of the new rater in evaluating the quality of used merchandise?

A warehouse specializing in selling used items is advertising for the position of Used Item Inspector to assess the quality of used items before listing them for sale. Inspectors are required to label used items in terms of their quality using grades “Like new (1)”, “Good (2)”, and “Acceptable (3)”. The company has a shortlist of two candidates, Candidate 1 and Candidate 2. A candidate will be hired if their ratings of items substantially agree with the rating of an experienced supervisor. Each candidate is presented with 25 used household items and asked to rate their quality on a scale of 1 to 3 or choosing the labels “Like new”, “Good”, and “Acceptable”. Similarity of ratings with those of the supervisor will be assed using weighted kappa inter-rater reliability method. Five ratings from the Supervisor, Candidate 1, and Candidate 2 are shown in Table 2.
| Supervisor | Candidate 1 | Candidate 2 |
|---|---|---|
| Like new | Like new | Like new |
| Like new | Like new | Acceptable |
| Good | Like new | Like new |
| Like new | Like new | Like new |
| Acceptable | Good | Acceptable |
| … | … | … |
The employer will conduct a Kappa measure of agreement between each of the candidates and the experienced supervisor. The data for this example can be downloaded in the SPSS format or in CSV format.
Entering Data into SPSS
To enter the data in the SPSS program, first we click on the Variable View tab (bottom left) and create three variables: Supervisor, Candidate01, and Candidate02. We specify the following attributes for each variable:
- Supervisor: Type is Numeric. Measure is Ordinal.
- Candidate01: Type is Numeric. Measure is Ordinal.
- Candidate02: Type is Numeric. Measure is Ordinal.
When defining the variables, we specify both the data type and the measurement level for SPSS. The data type is used by the program to interpret the data, while the measurement level is used by the statistical algorithm to decide what computation to perform.
For all three variables, we associate their values to descriptive labels (this is optional, but it helps interpretation and reading of the results). Each rater assigns value to the used item: 1 = Like new, 2 = Good, and 3 = Acceptable. Because these values have inherent orders, our variables are set as ordinal. We can assign labels to these values by clicking on the Values cells for each variable. Figure 1 shows how to create these value-label pairs.

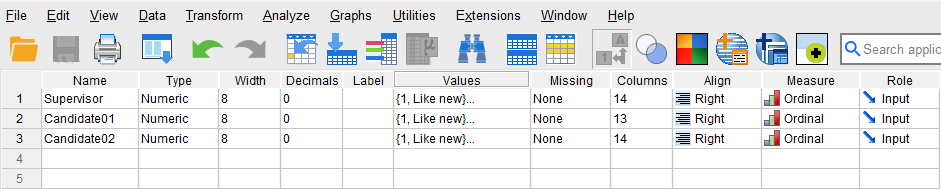
After creating all the variables, the Variable View panel of SPSS for our dataset should look like Figure 2.
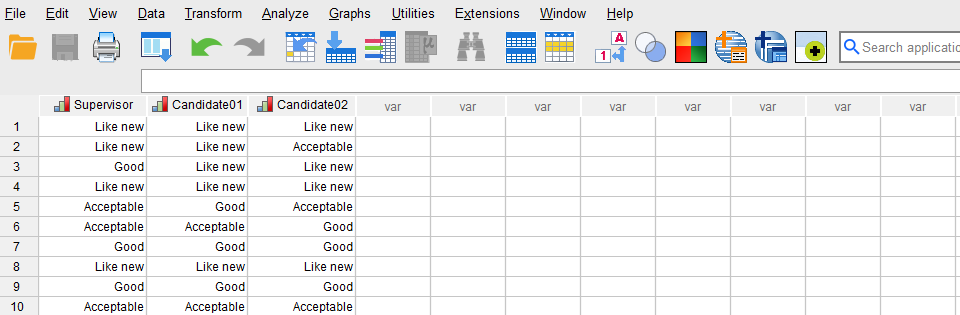
Once the variables are created, we switch to Data View of SPSS program to enter the data into the columns Supervisor, Candidate01, and Candidate02. We can enter the data as numeric values (1, 2, or 3) or use the labels we created (Like new, Good, Acceptable). Figure 3 shows how the data for all three variables should look like in the Data View tab.
Now we are ready to run the Kappa and weighted Kappa inter-rater agreement in SPSS!
Analysis: Kappa and Weighted Kappa in SPSS
In this section, we learn how to compute unweighted and weighted kappa inter-rater analysis on the example data. In our example, the employer intends to know which of the two candidates’ ratings of the used items is more in agreement with those of the experienced supervisor. In this example, because the rating values are ordered, the weighted kappa must be used. However, for pedagogical purposes, we demonstrate both unweighted and weighted Kappa coefficients in SPSS.
A: Unweighted Kappa in SPSS
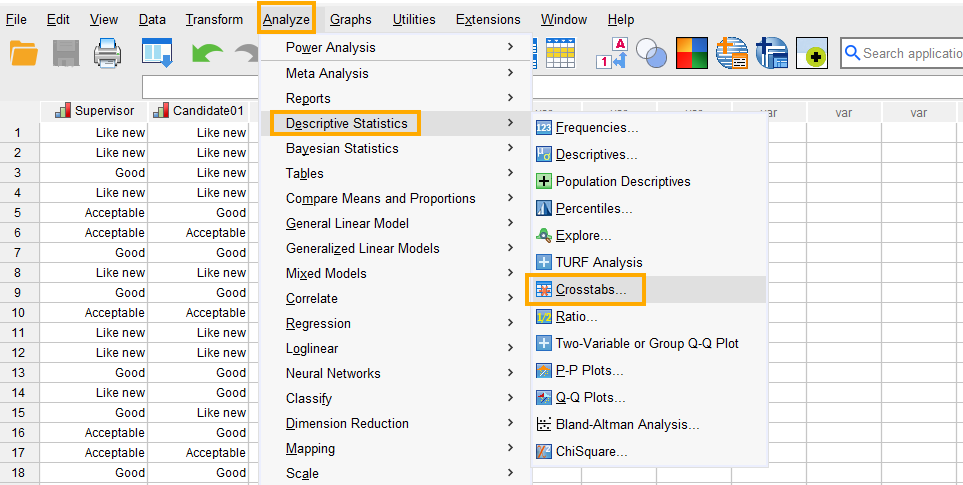
In SPSS, the unweighted kappa coefficient analysis can be run through the menu Analyze / Descriptive Statistics / Crosstabs. So, as Figure 4 shows, we click on Analyze and then choose Descriptive Statistics and then Crosstabs.
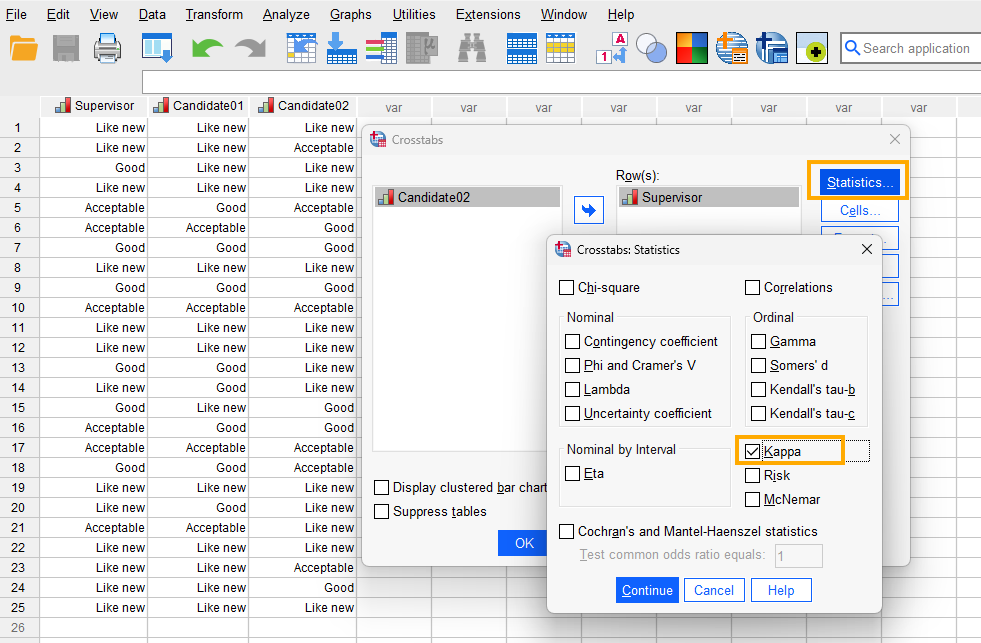
After clicking on Crosstabs, a window will appear asking for table rows and columns (Figure 5). Because Kappa analysis can be done only for two raters at a time, first we run the analysis between the Supervisor and Candidate 1 and one more time between the Supervisor and Candidate 2. So, we send Supervisor rater into the Row(s) box and Candidate 1 into Column(s) box. Next, in this window we click on Statistics.

After clicking on Statistics, a new window will appear in which we check Kappa (Figure 6).
Finally, we click on Continue and then OK to compute the unweighted Kappa agreement coefficient between the Supervisor and Candidate 1. We will follow the same steps to compute the unweighted kappa coefficient between Supervisor and Candidate 2 (only the results will be shown).
Interpreting Unweighted Kappa in SPSS
In the first table from SPSS output, Case Processing Summary (Figure 7), we can see the number of items (n = 25) and the number of missing items (n = 0) in the data set.

The next table is called Supervisor * Candidate01 Crosstabulation (Figure 8), or the confusion table. Each cell in this table shows the number of times the two raters correctly or incorrectly classify each item (agree and disagree).
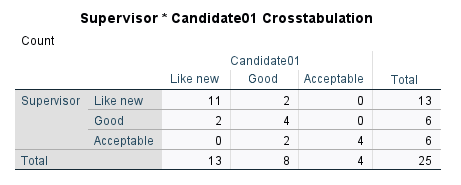
The last table, Symmetric Measures, shows the estimated kappa coefficient as degree of agreement between the Supervisor and Candidate 1 (Figure 9).
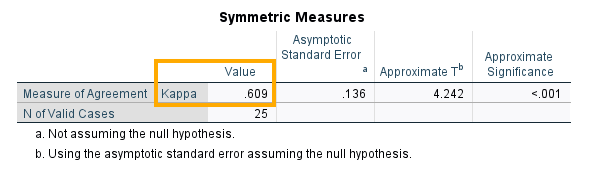
We can see that the Kappa measure of agreement between the Supervisor and Candidate 1 is 0.609, which is statistically significant (p < 0.05). How about the degree of agreement between the Supervisor and Candidate 2? We can follow the same steps and get the following results in Figure 10).

We can see that the Kappa measure of agreement between the Supervisor and Candidate 2 is much lower, at 0.414, which is statistically significant (p < 0.05). We may conclude that Candidate 1 is more reliable than Candidate 2 in assessing the quality of used items as measured by their agreement with the experienced supervisor.
However, because the ratings in this example are ordered (1, 2, 3 or Like new, Good, Acceptable), we must use the weighted Kappa to compute the agreement between the candidates and the supervisor. In the following section, we learn how to compute the weighted kappa agreement coefficient in SPSS.
B: Weighted Kappa in SPSS
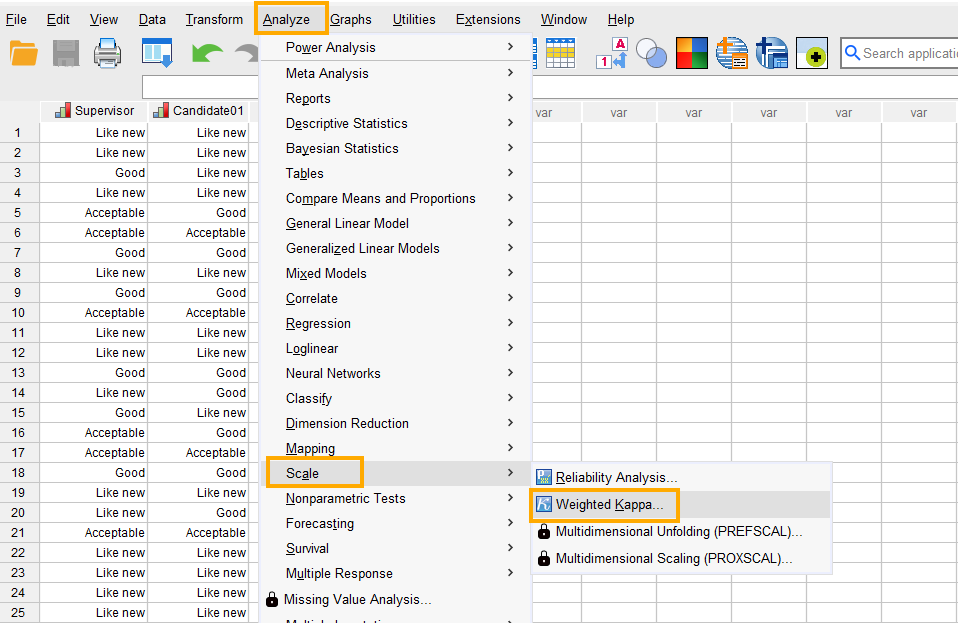
Weighted Kappa is used when two raters rate ordered categorical variables consisting of three or more categories. The weights in weighted Kappa agreement are usually either linear (equal weights between the categories), quadratic (unequal weights), or custom derived by subject matter experts. In SPSS, the weighted Kappa coefficient analysis can be run through the menu Analyze / Scale / Weighted Kappa (Figure 11).
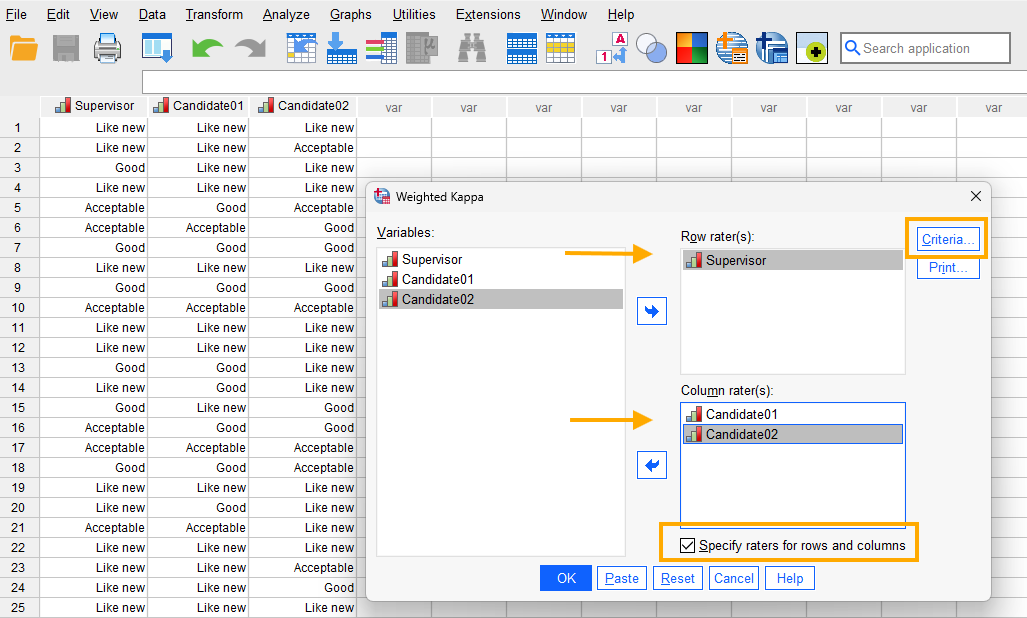
After clicking on Weighted Kappa, a window will appear asking for raters. First, however, at the bottom of this window, we check the option “Specify raters for rows and columns” so that we can compute the weighted Kappa coefficients at the same time between the Supervisor and Candidate 1 and between the Supervisor and Candidate 2. We send the Supervisor into the Row rater(s) and the candidates into the Column rater(s) and then click on Criteria button (Figure 12).
After clicking on the Criteria button, a new window will appear that allows us to choose the type of weight for kappa. The choice of weight scale is guided by subject matter experts. However, the quadratic weight is more often used and we follow suit (Figure 13).

Finally, we click on Continue and then OK to obtain the weighted kappa coefficients.
Interpreting Weighted Kappa in SPSS
Because we chose to compute the weighted kappa coefficients at the same time between the Supervisor and Candidate 1 and the Supervisor and Candidate 2, we obtain only one table of results (Figure 14).

In Cohen’s Weighted Kappa table, we can see the weighted kappa coefficients between the Supervisor and Candidate 1 is 0.806 (with 95% confidence interval between 0.649 and 0.963) and between the Supervisor and Candidate 2 is 0.472 (with 95% confidence interval between 0.117 and 0.826). We can conclude that the ratings by Candidate 1 are more in agreement with the experienced supervisor and, therefore, Candidate 1 is more qualified for the Used Item Inspector position.
Reporting Weighted Kappa Analysis Results
The study evaluated the consistency of two candidates in rating the quality of used merchandise against the judgments of an experienced supervisor. Each candidate assessed 25 items using an ordinal scale of “Like new,” “Good,” and “Acceptable.” The supervisor’s ratings served as the reference standard. Results revealed that Candidate 1’s evaluations were highly consistent with the supervisor, yielding a weighted kappa coefficient of 0.806 (95% CI: 0.649–0.963), which reflects strong agreement. By contrast, Candidate 2’s ratings produced a weighted kappa of 0.472 (95% CI: 0.117–0.826), indicating only moderate agreement. These findings suggest that Candidate 1 demonstrated greater reliability in distinguishing item quality categories, while Candidate 2’s judgments were less aligned with expert evaluation. Overall, the analysis result supports Candidate 1’s suitability for the inspector role, given their stronger alignment with professional standards of assessment.