SPSS FOCUS
A comprehensive guide to statistical analysis in SPSS
Spearman Correlation in SPSS
The Spearman correlation is a statistical method that measures the strength and direction of the monotonic relationship between two variables that could have nonlinear relationship. Unlike Pearson correlation, which assesses linear relationships, Spearman correlation evaluates how well the variables maintain a consistent increasing or decreasing trend, regardless of exact linearity, using the ranks of the values in the two variables (hence being a nonparametric test). The Spearman rho correlation coefficient (ρ) ranges from -1 to 1, where values near -1 or 1 indicate a strong correlation, and values close to zero suggest a weak or no correlation. Spearman correlation is particularly useful for ordinal data or for data that does not meet the assumptions of normality required by Pearson correlation, such as when there are outliers in the data because ranks are robust to outliers.
Introduction to Spearman Correlation
When analyzing multiple variables in a dataset, some of them may maintain a relationship with each other. For instance, consider a health study where a researcher records the number of hours participants exercise and their corresponding weight loss. Intuitively, increasing exercise time should lead to greater weight loss, indicating a correlation between these two variables. This relationship can be quantified using a correlation coefficient.
The choice of statistical method for measuring a relationship depends on the nature of the data, particularly whether the relationship between the variables is linear and if the data distribution is normal. A nonlinear relationship occurs when the rate of change in one variable differs from the rate of change in the other. Graphing the data may reveal such nonlinear patterns. Additionally, the assumption of normality is required for some correlation tests, such as Pearson’s correlation. However, if the data is ordinal—such as rankings from two evaluators on a writing test—or if the linearity and normality assumptions are not met, Spearman’s rho correlation is a suitable alternative.
Similar to other correlation coefficients such as Pearson’s or Kendall’s tau, the Spearman rho coefficient quantifies the strength of a relationship, ranging from -1 to +1. A coefficient of 0 indicates no correlation between the two variables. A positive correlation means both variables move in the same direction, either increasing or decreasing together. Conversely, a negative correlation occurs when one variable increases while the other decreases, signifying an inverse relationship.
In the following sections, we present an example research scenario where the Spearman correlation method will be used to analyze the data. We will demonstrate how to perform the Spearman correlation in the SPSS program step-by-step and how to interpret the SPSS results for Spearman correlation.
Spearman Correlation Example
Is there a relationship between the number of hours individuals exercise and their weight loss?

Photo courtesy: gabin-vallet, Unsplash.
A health researcher would like to understand whether a relationship exists between the number of hours individuals exercise per week and their weight loss over six months. To investigate this, the researcher randomly selects 43 participants who report their weekly exercise hours through a questionnaire. Additionally, each participant records their initial body weight at the start of the study and their final weight at the end of six months. Weight change is measured by subtracting weight at the sixth month from weights recorded at baseline. Table 1 presents data on the weekly exercise hours and the corresponding weight loss (in pounds) for five participants in the study.
| Participant | Exercise Hours | Weight Loss (lb) |
|---|---|---|
| Participant 1 | 2 | 1.6 |
| Participant 2 | 2.5 | 1.8 |
| Participant 3 | 2.5 | 1.8 |
| Participant 4 | 3 | 1.8 |
| Participant 5 | 3.5 | 2.0 |
| … | … | … |
The health researcher enters the data in the SPSS program in the computer lab. The data for this example can be downloaded in the SPSS format or in CSV format.
Entering Data into SPSS
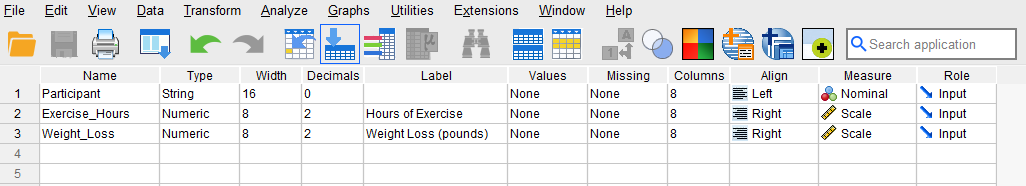
To enter the data in the SPSS program, first we click on the Variable View tab (bottom left) and create three variables under name column: Participant, Exercise hours, and Weight loss. We specify the following attributes for each variable:
- Participant: Type is string. Width is 16. Measure is Nominal.
- Exercise_Hours: Type is Numeric. Measure is Scale.
- Weight_Loss: Type is Numeric. Measure is Scale.
When defining the variables, we specify both the data type and the measurement level for SPSS. The data type is used by the program to interpret the data, while the measurement level is used by the statistical algorithm to decide what computation to perform.
In this data set, the Participant variable consists of participant names or ID’s and is not included in computation; therefore, we select “String” as the data type and “Nominal” as the measurement level. We increase the width of the Participant variable to 16 characters so that the full names / IDs for longer strings are shown. For the two continuous variables (Exercise_Hours and Weight_Loss), we choose Numeric for their data types and Scale for their measurement level (SPSS uses the term scale for interval and ratio measurement levels). After creating all variables, the Variable View panel of SPSS for our dataset should look like Figure 1.
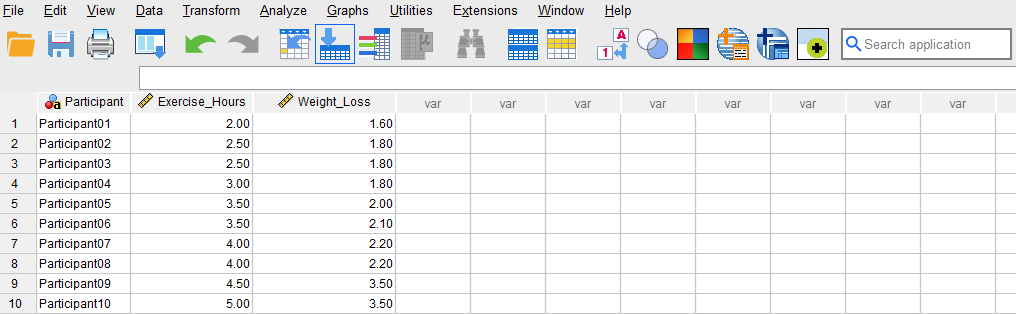
After creating the variables, we switch to Data View and enter the data into the columns Participant, Exercise_Hours, and Weight_Loss. For Participant, we can enter their names or an ID. For the variable Exercise_Hours, we enter the number of hours each participant reports exercising on average per week. Finally, we enter the amount of weight loss (in pounds) in Weight_Loss column for each participant. Figure 2 shows how the data for all three variables should look like in the Data View tab.
Now we are ready to conduct a Spearman correlation test in SPSS!
Analysis: Spearman Correlation in SPSS
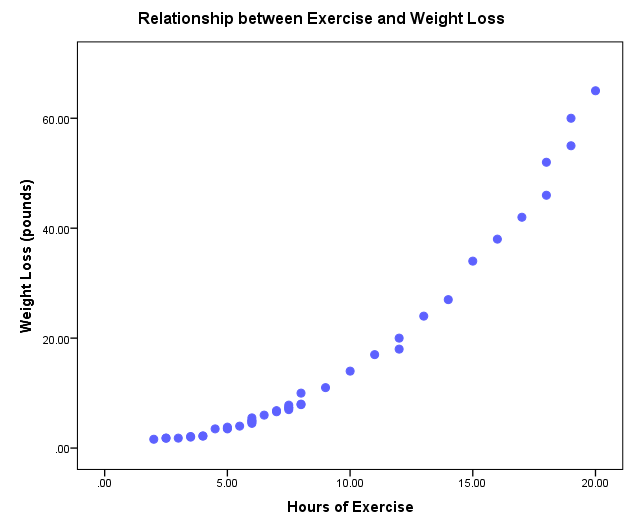
A Spearman correlation test is a statistical method used to assess the strength and direction of a relationship between two random variables, even when the relationship is not strictly linear. In this example research study, a health researcher investigates the possible relationship between the number of weekly hours individuals spend exercising and the amount of weight they lose over six months. To explore this, the researcher collects data from a random sample of 43 participants who report their weekly exercise hours and track their weight at the beginning and end of the study. Using the Spearman correlation test, the researcher can determine the strength of the relationship and if the correlation is positive or negative. A preliminary plot in Figure 3 shows that there is a nonlinear relationship between Exercise hours and Weight loss among the selected participants.
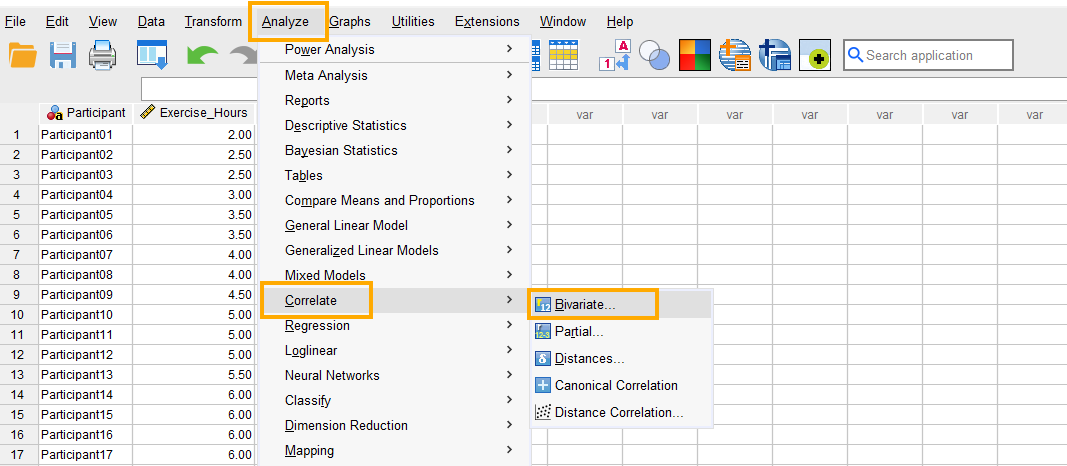
In SPSS, the Spearman correlation can be accessed through the menu Analyze / Correlate / Bivariate. So, as Figure 4 shows, we click on Analyze and then choose Correlate and then Bivariate (bivariate means two variables).
After clicking on Bivariate, a window will appear asking for Variables we want to find a correlation for (Figure 5). We send both Exercise_Hours and Weight_Loss into the Variables box. Next, in this window we check Spearman option, choose Two-tailed test of significance and also check Flag significant correlations (to mark if the correlation coefficient is statistically significant).
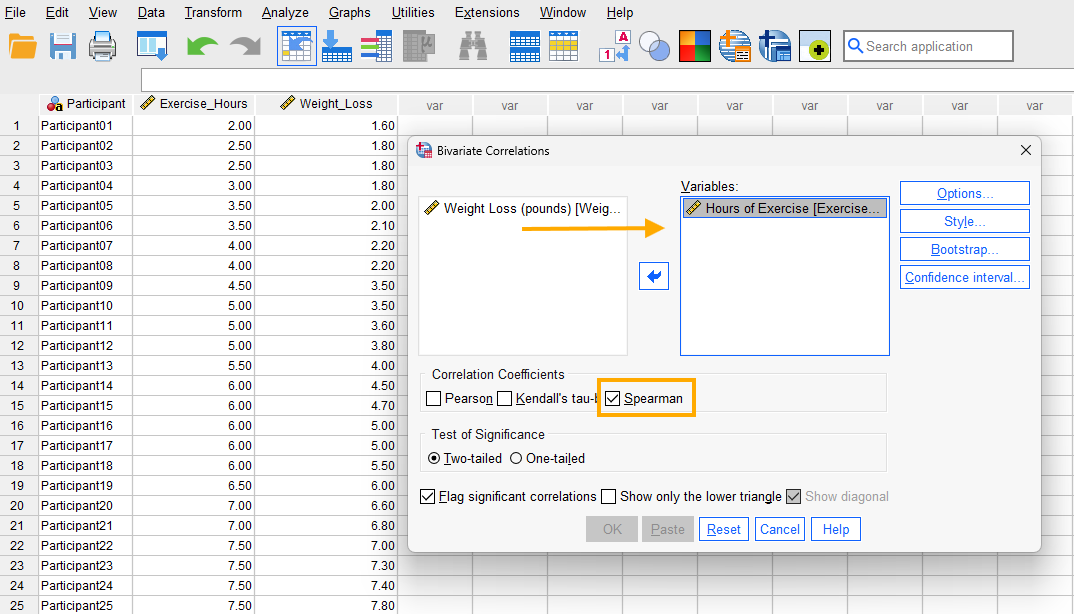
Finally, we click on OK to run the Spearman correlation test. SPSS will produce the results of the Spearman correlation test in the Output window.
Interpreting Spearman Correlation in SPSS
In our example research, a health researcher is interested in investigating the relationship between the number of weekly hours individuals dedicate to exercising and their weight loss. Because the two variables are both continuous and the relationship seems to be nonlinear (according to Figure 3), the researcher uses Spearman correlation test to investigate the presence and direction of any relationship.
As the scatter plot in Figure 3 shows, there seems to be a nonlinear relationship between Exercise hours and Weight loss. The relationship is positive, meaning as the number of weekly exercise hours increases the weight loss on average increases as well. We also want to know the strength of the relationship and if it is statistically significant. So, we look at the (nonparametric) correlations table in the SPSS output (Figure 6).
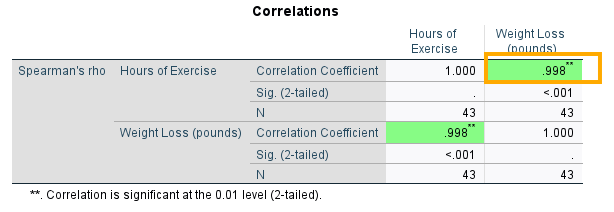
The correlation table in Figure 6 has two rows (Hours of Exercise and Weight Loss), but they are the same variables in different orders. They both show the Spearman correlation between Exercise hours and Weight loss. The last column shows that the Spearman correlation coefficient between Exercise hours and Weight loss is 0.99 and positive, which is also statistically significant (Sig. 2-tailed = 0.000 or p < 0.05). So, we can conclude that there is a high correlation between weekly exercise hours and weight loss. As individuals exercise more, they are likely to lose more weight.
Reporting Spearman Correlation Analysis Results
In this study, we aimed to investigate the relationship between the number of weekly exercise hours and weight loss over six months. A random sample of 43 participants was selected, and data were collected on their self-reported weekly exercise duration and recorded body weight at the beginning and end of the study period.
The Spearman correlation analysis revealed a strong relationship between exercise hours and weight loss, with a correlation coefficient of rho = 0.99, indicating a significant association. This suggests that as individuals engage in more hours of exercise per week, their weight loss tends to follow a consistent increasing trend, even if the exact rate of loss varies.
These findings highlight the potential impact of sustained exercise routines on weight management. A strong correlation of this nature supports the idea that individuals who commit more time to physical activity are likely to experience greater weight loss. These results provide useful insights for health professionals and individuals seeking effective strategies for weight management and fitness improvement.